Use graph theory to improve employee engagement and communication through influencers and key actors detection.
During the past months I’ve been researching data science solutions designed to help the area of human resources in their daily tasks. Why? Well, let’s say it is a really interesting area that, in my opinion, doesn’t get enough attention. Regardless of the organization, the future success of a company relies heavily on their current and future employees, so why not focus on them? In this regard, I’ve found that most of the standard solutions revolve around the following ideas:
- CV Parsers;
- Chatbots for recruiting;
- Employee churn models;
- Recommender systems for training courses.
As you can see, except for the churn models, these solutions fail to provide strategic value for a company and real benefits for employees. But, what can be done then? Well, another relevant set of solutions that is not really talked too much about belongs to the topic of Organizational Network Analysis. In this introduction we will go through the key concepts behind it with some simulated examples in Python to make things easier to digest. So, what is Organizational Network Analysis? To be able to answer this question we first need to understand the concept of organization network.
…
A) Networks: a tool to understand your organization
As mentioned by Barabási (2013), the organization network is a social network formed by the members of an organization that regularly interact with each other. According to Tichy, N., Fombrun, C. (1979), this network is characterised for representing social interactions in terms of social objects (people or groups) where not necessarily every object is connected to the whole network due to the lack of interactions, and some of them can share more than one connection. Furthermore, through these interactions the actors of the network establish links by sharing information, affection, influence and goods or services. In other words, we have a network of employees (nodes) that are linked through their interaction (edges). This functional representation of an organization can be helpful to understand several work dynamics that otherwise would be hidden.
From this perspective, Liu, J., Moskvina A., Ouředník, M. (2017) formally defineOrganizational Network Analysis (ONA) as the systematic exploration of the organizational networks through the use of techniques taken from graph theory. Its objective is to gain a better understanding of the management structures, the interpersonal relationships and the flow of information inside an organization. In this regard, the scope of this analysis can be really broad: from descriptive analytics of the characteristics of detected influencers, informal leaders, people that resign (exit the network), and highly/poorly engaged employees, to predictive models that aim to provide real value through a more robust interpretation of these kinds of internal behaviours. However, keep in mind that as in any data science project, the data maturity of the organization needs to be considered before offering any of these solutions (you should start by gathering and processing the data with a well defined objective, then offer analytics, and finally move on to predictive and prescriptive models).
Now you may be thinking that all of this sounds good, but in order to make any type of analysis you first need to get a hold of the organization network, which can be quite tricky. To do so, one can follow the main approach which consists of making surveys where all employees are asked to nominate other co-workers (of any area of the organization) as referents of different aspects of their work life. These surveys could be done online or through any of the popular resource management tools such as Workday. Some of the questions asked could be:
- Who are the people you seek when you want to know important information about the future of the company? (there’s a nice and detailed example of this in Barabási’s Network Science book).
- Who are the people that give you emotional support?
- Who are the people that you rely on when you need to solve technical tasks (for example, using software A)?
- Who is the person that motivates you the most?
- Who are the people you regularly interact the most during your day?
As you can see, the success of the correct representation of the network depends on the participation rate and the honest response of employees that know that their answers aren’t anonymous. Here, it is key for the Human Resources department to take an active role in the whole process (as a suggestion, they could make the surveys compulsory and work on communicating their benefits — mentioned later — to achieve better results).
After finishing the data collection step, we can build the directed graph (network) where the nodes are employees and their directed links represent a nomination from one to another. As an example from a simulation I will explain later on, for an organization with 40 members this would look as something like this:

In this graph, the colours represent some grouping attribute of the nodes that helps us classify them (in this case, it refers to the area where each employee was assigned to “work” in). Note that the arrows point to the direction of the nominations, and in the cases where no nominations were received or emitted we have isolated nodes.
Once we finished building the network, it is time to look for the influencers and key actors of the organization. But, what exactly is an influencer or key actor? How can we tell? This isn’t set in stone as there are several ways in which someone can fall in either of these categories, and they are a “little bit” more complex than just considering the most nominated people. For example, if we take into consideration the set of questions listed above, there are at least 4 types of influential people. Some of them might be key to the information flow of the organization, while others may be essential motivators, emotional supports or technical referents. Additionally, we can find members that help other people reach these influential people (which in turn also makes them influential). Nevertheless, at the minimum we can say that all of them share a quality: some degree or type of centrality inside the network. Here’s where we need to introduce some individual metrics taken from network science that are imperative for this kind of analysis. For the sake of keeping things simple we will just mention the main ideas behind some of them:
- Degree: The degree of a node is defined as the number of links from other nodes that point to this. When the network is directed it is necessary to make a distinction between the links that point to a node (in-degree) and the links that point from a node to other nodes (out-degree). Following the example of this article, you can think of it as the number of people that nominated you vs the number of people you nominated.
- Closeness centrality: this metric (between 0 and 1) measures the average distance of a node to the rest of the nodes in the network (in terms of the number of steps needed to reach them). This allows us to have a notion of the average proximity to the rest of the network. Through this perspective, you could identify an influencer or key actor as the person (or people) whose closeness index is above certain threshold.
- Betweenness centrality: this metric (between 0 and 1) can be seen as a way to quantify the influence that a node has on the information flow of the network. It is mainly used to find nodes that serve as a bridge between groups of nodes. It is computed by calculating the shortest path between all the pairs of nodes, which allows to measure the frequency at which a node is located between the shortest paths of other nodes.
- Hubs and authorities scores: these scores (between 0 and 1) help us classify the nodes into three types: regular, hubs and authorities. Their characterisation can be summarised as follows: some nodes (hubs) have many links pointing to a few others (authorities) that aren’t frequently linked to the rest of the nodes (regular). One of the most common examples of this behaviour occurs in paper citations where the main knowledge is concentrated in the foundational papers (authorities), that in turn are cited by a series of papers (hubs) that are more frequently cited by the rest of the papers (regular). In the case of an organization network, authorities could be seen as leaders that communicate mainly with hubs who work as bridges between authorities and “regular” employees. Hence, we could say that both, hubs and authorities can be seen as key actors within the professional network.
If we were to calculate these metrics for a network such as the one above, we would obtain a table similar to this one:

Next, all that is left is to decide on some rules and thresholds to define what kind of behaviour we’ll be considering as indicative of being an influencer. An oversimplified approach could be to go with the top 5 scores of each of the six metrics and for each of them define a different class of actor. For example, those with the highest DegreeIn could be called “Sought members”, the top employees with DegreeOut could be named “Proactive members”, those with the highest Closeness and Betweenness scores could be called “Central members” and “Connector members” respectively, and finally we have the “Hubs” and “Authorities” of the network. Note that these are some random names I just thought about, you are free to choose the names you’d like.
By this point, besides the detected influencers, we also have an approximation to the “informal” organization with a set of network statistics per employee, and that by itself is quite valuable. The question is then, what can you do with this information? As mentioned in the title of this article, you could try to improve employee engagement and communication. How? Well, I’m neither a sociologist nor psychologist so I recurred to published papers, informal talks with professionals that work in the field to provide you the following list of summarised ideas:
- You can improve the information flow by spreading messages through the key detected nodes, which can aid with the perceived transparency of the organization and therefore improve employee engagement;
- You could improve the onboarding of new employees by pairing them with some of the key nodes;
- Processes of change management that require the selection of change leaders could take advantage of the ones detected with this approach. Likewise, it can be useful in cases where there’s a need to track the variation in the interactions of the members before and after the implementation of a new tool;
- During merger and acquisition processes, the whole methodology could be adapted to find knowledge experts and leaders that could aid to reduce the burden of such a stressful process, while keeping the operations running as smooth as possible;
- Paying attention to isolated or rarely nominated nodes may be a good idea, as being poorly connected to the organization may be indicative of a bad work life experience, low job satisfaction and engagement (Kahn, W. A. , 1990), and a deficient communication system. If you combine all this elements you could be in front of a member that is more prone to resign;
- Finally, and more interestingly, you could go beyond the descriptive statistics of Organizational Network Analysis (not ML or AI) and start thinking about implementing predictive models that try to answer some common questions using the additional information provided by the network as features. For example, given enough time you could complement your churn models with the network data obtained through several surveys.
Before concluding the general introduction to the topic of Organizational Network Analysis, it is important to highlight that this approach is not strictly constrained to the professional organization, since it could also be adapted to an educational institution (for both the staff and alumni) or any other context where a network of people can be created.
Next, for those interested in the “behind the scenes”, I describe how to build a basic network through a simulated scenario that assumes you were able to carry out a survey that simply asks you to nominate the members of the organization with whom you interact the most.
B) Simulating a network
We start by importing the libraries we’ll be using:
# General
import itertools as it
import numpy as np
import pandas as pd# Network
import networkx as nx
Before proceeding with the creation of the network, we first need to think about what design parameters we’ll be using. As the purpose is to create a fictional organization where different kinds of “influential” people can be found, we will need to specify:
- The number of employees;
- The number and names of the areas where the employees will be assigned;
- The size of the areas to know how many employees will “work” in each of them;
- The proportion of people that can have a higher probability of nominating/being nominated by others in each area;
- The probability of nominating/being nominated of highly connected people;
- The maximum probability of nominating/being nominated of the employees that do not belong to the highly connected class;
- The probability that a member of Area A nominates someone of Area B, as some areas are more likely to interact than others.
Given that, we now specify the global parameters that will define the network:
# GLOBAL PARAMETERS
# Set a seed to replicate the experiment
np.random.seed(1)# Specify the number of employees in the network
n_employees = 40# Specify the areas
m_areas = ['HR', 'IT', 'Finance', 'Marketing', 'Sales']# Specify the area sizes as percentage of total
area_sizes = [0.5/5, 2/5, 1/5, 0.5/5, 1/5]# Set the percentage of highly connected people per area
influencer_ratio=0.1# Give a higher probability of connection to a type of employee
influencer_link_probability=0.85# Give an upper bound to the link probability of a non "influencer" employee
max_non_influencer_link_probability=0.6# Create all pairs of areas to define their interaction probability
areas_links_combinations = list(it.combinations(m_areas,2))# Specify the probability of each pair
areas_links_probability = [0.1, 0.2, 0.3, 0.4,
                           0.4, 0.2, 0.7, 0.7,
                           0.6, 0.9]
Next, we create the employees and we assign them to an area:
# Generate a list of employees
employees = [f'Employee_{n}' for n in range(n_employees)]# Generate an array of employee's areas
# using the area sizes as assignment probabilitiesemployees_areas=np.random.choice(a=m_areas,
                                 size=n_employees,
                                 replace=True,
                                 p=area_sizes)# Join the data into a pandas DataFrame
df=pd.DataFrame({'Employee':employees,'Area':employees_areas})
Once we have our DataFrame of employees and areas we define the nomination probability of each of them:
# For low link probability people a random uniform distribution
# is usedlower_proba_assignment=lambda x : np.random.uniform(
non_influencer_link_probabilities[0],
non_influencer_link_probabilities[1])# Assign the link probabilities per area and combine the data
dfs=[]
for area in m_areas:  df_area=df[df['Area']==area].copy()  area_employees = df_area.shape[0]  n_influential = round(area_employees*influencer_ratio)  influ_employees=df_area['Employee'].sample(n_influential).values  df_area['Link_Probability']=np.where(
                          df_area['Employee'].isin(influ_employees),
                          influencer_link_probability,
                          df_area['Employee'].apply(
                                            lower_proba_assignment))
  dfs.append(df_area)df=pd.concat(dfs,ignore_index=True)
Our DataFrame looks like this:

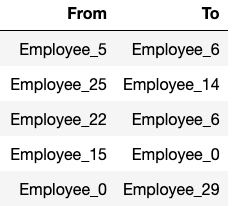
Now that we have the nodes and the individual probability to nominate/be nominated, we can proceed to create their links. To do so, we’ll start by generating all possible combinations of links (excluding the cases where they nominate themselves).
# Create the links DataFrame
possible_links=list(it.product(df['Employee'],df['Employee']))
df_links=pd.DataFrame(possible_links, columns=['From','To'])
df_links=df_links[df_links['From']!=df_links['To']].copy()
After obtaining all the pairs we have the following data structure:
What we need to do now is to define which links we are going to be keeping based on the area each employee belongs to (some areas are more likely to interact), and their assigned nomination probability (some people are more prone to being nominated/nominate than others). To do that we need to merge the DataFrame with employees and link probabilities with the links DataFrame:
# Merge links DataFrame with employee data based on the 'From' side
df_links=pd.merge(df_links,
                  df[['Employee','Area','Link_Probability']],
                  left_on='From',
                  right_on='Employee',
                  how='left')# Drop the employee column as we'll need to do another merge
df_links.drop(['Employee'],axis=1, inplace=True)# Rename columns to know to what employee the data belongs to
df_links.rename(columns={'Area':'From_Area',
                        'Link_Probability':'From_Link_Probability'},
                        inplace=True)# Merge links DataFrame with employee data based on the 'To' side
df_links=pd.merge(df_links,
                  df[['Employee','Area','Link_Probability']],
                  left_on='To',
                  right_on='Employee',
                  how='left')# Rename the columns
df_links.rename(columns={'Area':'To_Area',
                         'Link_Probability':'To_Link_Probability'},
                          inplace=True)# Drop the employee column as we don't need it anymore
df_links.drop(['Employee'],axis=1, inplace=True)df_links.rename(columns={'Area':'To_Area',
                         'Link_Probability':'To_Link_Probability'},
                         inplace=True)
With the previous step we joined the individual link probability, but we still need to add the probability of nominations between members of different areas. In particular, as there are two ways of showing a pair of areas (A,B) and (B,A), we’ll need to mirror the probabilities of linkage:
# Start by creating a DataFrame with the first way
external_proba_a=pd.DataFrame(areas_links_combinations,
                              columns=['From_Area','To_Area'])external_proba_a['Area_Pair_Probability']=areas_links_probability# Mirror the previous transformation but renaming the columns
external_proba_b=external_proba_a.copy()external_proba_b.rename(columns={'From_Area':'To_Area',
                                 'To_Area':'From_Area'},
                                 inplace=True)# Concatenate both DataFrames
external_proba=pd.concat([external_proba_a,
                          external_proba_b],
                         ignore_index=True)# Link the DataFrame of links with the "external" probabilities
df_links=pd.merge(df_links,
                  external_proba,
                  on=['From_Area','To_Area'],
                  how='left')# In the cases where the area is the same
# we'll keep a probability close to 1 (0.9)
# meaning the nomination depends mainly on the individual
# probabilitydf_links['Area_Pair_Probability']=np.where(
  df_links['From_Area']==df_links['To_Area'],
  0.9, df_links['Area_Pair_Probability'])# For the majority of the cases, the final pair probability
# will equal the average between individual probabilities
# times the area probabilitydf_links['Pair_Probability']=df_links['Area_Pair_Probability']*  (df_links['From_Link_Probability']+
 df_links['To_Link_Probability'])/2# In case an employee has the highest link probability
# we'll make him more prone to receive nominations than to make
# nominations by halving the pair probability df_links['Pair_Probability']=np.where(
df_links['From_Link_Probability']==influencer_link_probability,
df_links['To_Link_Probability'],df_links['Pair_Probability']/2)df_links['Pair_Probability']=np.where(
df_links['To_Link_Probability']==influencer_link_probability, df_links['From_Link_Probability'],
df_links['Pair_Probability']/2)
# Finally, use the Pair_Probability to flip a coin
# and decide if the pair will be considered (Active_Link=1) or notdf_links['Active_Link']=df_links.apply(lambda x: np.random.binomial(n=1,p=x['Pair_Probability']),axis=1)
Thanks to this step, we are able to define our nodes and links:
nodes = employees# We create a list of tuples of pairs of nodes to define the links
links = df_links[df_links['Active_Link']==1][
                 ['From','To']].to_records(index=False)
Now we are ready to build the network and calculate the metrics:
# Create an instance of a Directed Graph using networkx
G = nx.DiGraph()# Add the nodes and links to the graph
G.add_nodes_from(nodes)
G.add_edges_from(links)# Calculate all the metrics mentioned in the previous section:# DegreeOut
degree_df_out=pd.DataFrame(G.out_degree,
                           columns=[“Employee”,”DegreeOut”])# DegreeIn
degree_df_in=pd.DataFrame(G.in_degree,
                          columns=[“Employee”,”DegreeIn”])# Closeness
closeness_df=pd.DataFrame.from_dict(nx.closeness_centrality(G),
                                    orient=”index”).reset_index()closeness_df.columns=[“Employee”,”Closeness”]# Betweenness
betweenness_df=pd.DataFrame.from_dict(nx.betweenness_centrality(G),orient=”index”).reset_index()betweenness_df.columns=[“Employee”,”Betweenness”]# Hubs and Authorities
hubs, authorities = nx.hits(G, normalized=True)hubs_df=pd.DataFrame.from_dict(hubs, orient="index").reset_index()
hubs_df.columns=["Employee","HubScore"]authorities_df=pd.DataFrame.from_dict(authorities,
                                      orient="index").reset_index()authorities_df.columns=["Employee","AuthorityScore"]# Merge the results
results=pd.merge(df, degree_df_in, on="Employee",how='left')
results=pd.merge(results, degree_df_out, on="Employee",how='left')
results=pd.merge(results, closeness_df, on="Employee",how='left')
results=pd.merge(results, betweenness_df, on="Employee",how='left')
results=pd.merge(results, hubs_df, on="Employee",how='left')
results=pd.merge(results, authorities_df, on="Employee",how='left')results=results.sort_values(by='Closeness', ascending=False)
With this last step, a table such as the one showed in the first section of the article is obtained. As you can see, it is fairly simple to adapt the code to use real data (you would only need to run the last chunk after defining the nodes and links from the nominations).
Concluding Remarks
Through out this article we’ve discussed the main ideas behind Organizational Network Analysis, while proposing some use cases and providing the tools necessary to begin a simple project in your organization/institution. In this sense, I encourage you to try to run your own simulated scenarios and if possible, take the next step towards the development of predictive models based on network metrics. From my experience, these metrics do add valuable information to predictive models (at least to those of churn and engagement).
Don’t forget to like and suscribe for more content related to the solution of real business problems 🙂.
References
Tichy, N., Fombrun, C. 1979. Network analysis in organizational settings. Human Relations, 32(11), 923–965.
Barabási, A. L. 2013. Network science. Philosophical Transactions of the Royal Society A: Mathematical, Physical and Engineering Sciences, 371(1987), 20120375.
Liu, J., Moskvina A., Ouředník, M. 2017. Towards a decision support system for organizational network analysis using multiplex interpersonal relations. Multi-agent and Complex Systems. Springer, 33–47.
Kahn, W. A. 1990. Psychological conditions of personal engagement and disengagement at work. Academy of management journal, 33(4), 692–724.
Karanges, E., Johnston, K., Beatson, A., Lings, I. 2015. The influence of internal communication on employee engagement: A pilot study. Public Relations Review, 41.
Thanks to Lucas Nicolás Romeo